Designing Insights: Exploring the Diversity of Dashboard Types in UI/UX


Every successful business relies on actionable insights – and the key to tap them lies in the diverse world of dashboard designs.
In the world of UI/UX design, dashboards serve as vital tools for delivering intuitive user experiences. These digital hubs seamlessly blend functionality with aesthetics to provide users with easy access to data-driven insights.
From strategic to operational dashboards, each type is meticulously crafted to cater to specific user needs.
Through thoughtful layout, intuitive navigation, and visually appealing data visualization, UI/UX designers transform complex datasets into digestible information, empowering users to make informed decisions effortlessly.
In essence, dashboards in the UI/UX domain epitomize the fusion of form and function, enhancing the user experience with efficiency and elegance.
What is a Dashboard?
A dashboard is a visual tool that brings together essential information. How? By presenting it in a way that’s easy to understand.As the best UI UX design company in India, we think of it as your data’s home base, where you can quickly grasp what’s happening and make informed decisions.
It is where raw data transforms into meaningful insights, providing a real-time overview of key performance indicators (KPIs) and operational metrics.
Whether you’re tracking performance, monitoring tasks, or analyzing trends, a dashboard design simplifies the complex world of data into actionable insights.
Importance of Visualizing Data
Turning data into visuals is a game-changer. Moreover, humans process visuals faster than text.
Let me tell you why it’s more than just eye candy:
- Easy to Understand: Pictures make data simple. They help us get what the numbers are saying without getting lost in them.
- See Trends and Patterns: Pictures show us trends and patterns in data. It’s like a magnifying glass for important stuff that might hide in many numbers.
- Decide Faster and Better: Decisions become quicker and more competent when we see the whole picture. It’s like having a superpower for making choices.
- Share Information Easily: Pictures speak a universal language. They help everyone understand the story behind the data, no matter what language they speak.
- Remember Better: We remember things better when we see them. Visuals make data stick in our minds so we can use it later.
Why do I need a dashboard?
When used effectively, dashboards can significantly change how your organization operates. Here are three reasons to invest in this tool.
1. Get more value out of your data
A well-designed dashboard is a powerful tool for sharing information and promoting collaboration across departments. With it, you can display crucial business data and be assured that everyone in the organization can understand them and leverage them to make better decisions.
2. Consolidate and automate multiple data points
Dashboards bring different types of information together on a single reporting interface. As a result, you can create reports easier and faster. You no longer have to log into multiple services and open many spreadsheets.
3. Align teams and departments
Data doesn’t lie. When it comes to collaboration across departments, dashboard designs give you a clear and unbiased view of your business’s current performance. This way, everyone can discuss strategies for improvement since they know exactly how things are going.
Types of Dashboards
Dashboards can be classified into four main types based on their purpose, functionality, and design.
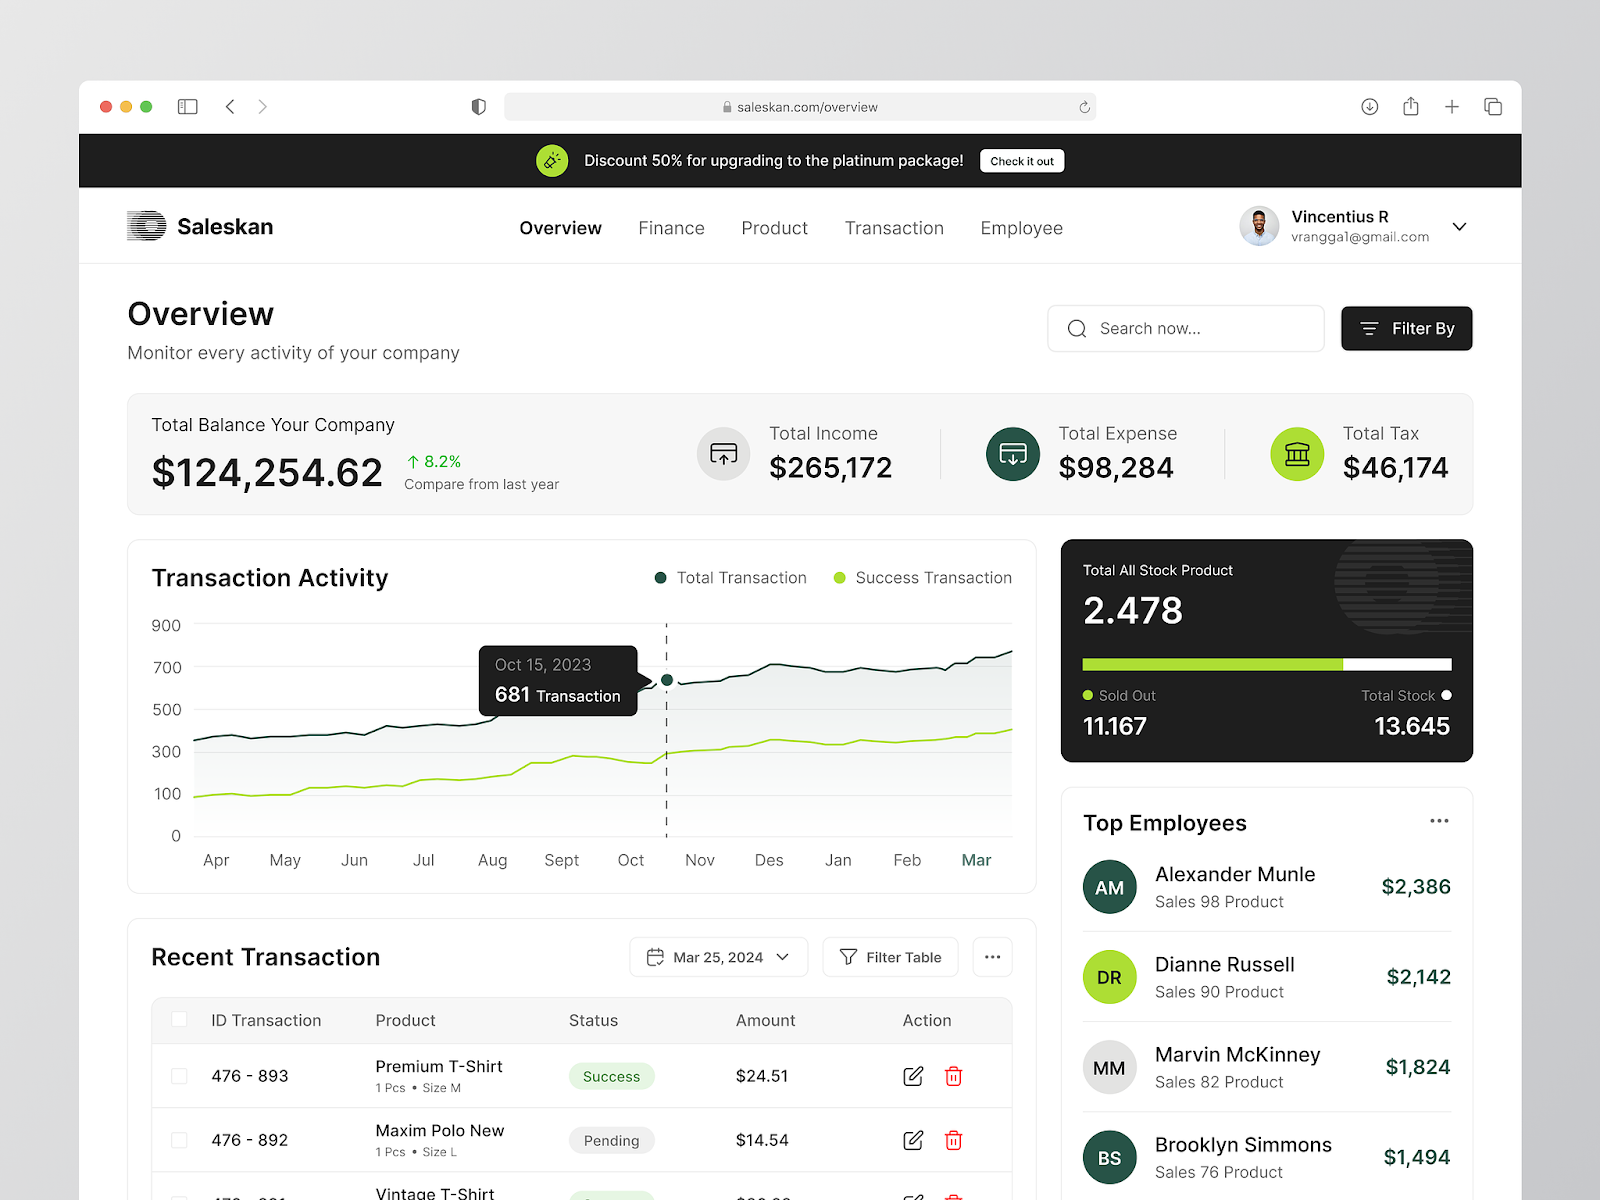
1. Strategic dashboard
A strategic or executive dashboard is the command center for organizational oversight. This dashboard type is tailored for high-level strategic planning. It offers a comprehensive snapshot of the organization’s overall health and performance.
Say for example, energy management dashboard designs, it’s like a unique control panel that gives these top-level decision-makers a clear and up-to-the-minute view of how the company is doing overall.
These dashboards are designed for important stuff – not the nitty-gritty details but the high-level plans and big goals. They show significant numbers and trends that help you make decisions that steer the company in the right direction.
For example, they keep an eye on goals, watch how money flows in the company, and even act like a superhero, alerting them about potential problems.
Key Features:
- KPI Tracking: It monitors the significant numbers that help make decisions. Moreover, these dashboards act as an immediate compass for executives.
- Trend Analysis: Visualizes long-term trends in business performance. This offers insights into the trajectory of the organization.
- Goal Tracking: It’s all about seeing how close the company is to hitting its big goals.
- Financial Metrics: An executive dashboard offers insights into financial health and performance. This serves as a vital indicator for fiscal decision-making.
- Market Analysis: Includes data about market trends and competitive landscapes. This is so that executives understand the external business environment.
- Risk Management Tools: Identifies and monitors potential risks, providing a proactive approach to risk mitigation.
- Performance Benchmarks: Compares organizational performance against industry standards, facilitating a comprehensive performance evaluation.
- Forecasting Tools: Predicts future trends based on historical data. It is more like guessing what might happen based on what happened before.
- Data Aggregation: It’s more like connecting the dots. They integrate data from various sources for a holistic view. This ensures that decision-makers comprehensively understand the organizational landscape.
- Customizable Views: The dashboard can be tailored to specific executive needs. The information presented aligns with individual preferences and priorities.
Who is it for?
Strategic dashboards are primarily used by senior executives, board members, and other high-level decision-makers within an organization. These individuals rely on strategic dashboards to monitor overall organizational performance, identify trends, and assess progress towards long-term strategic goals.
Strategic dashboards are commonly found in executive boardrooms, strategic planning sessions, and leadership meetings, where they serve as essential tools for guiding strategic decision-making and aligning organizational efforts towards common objectives.
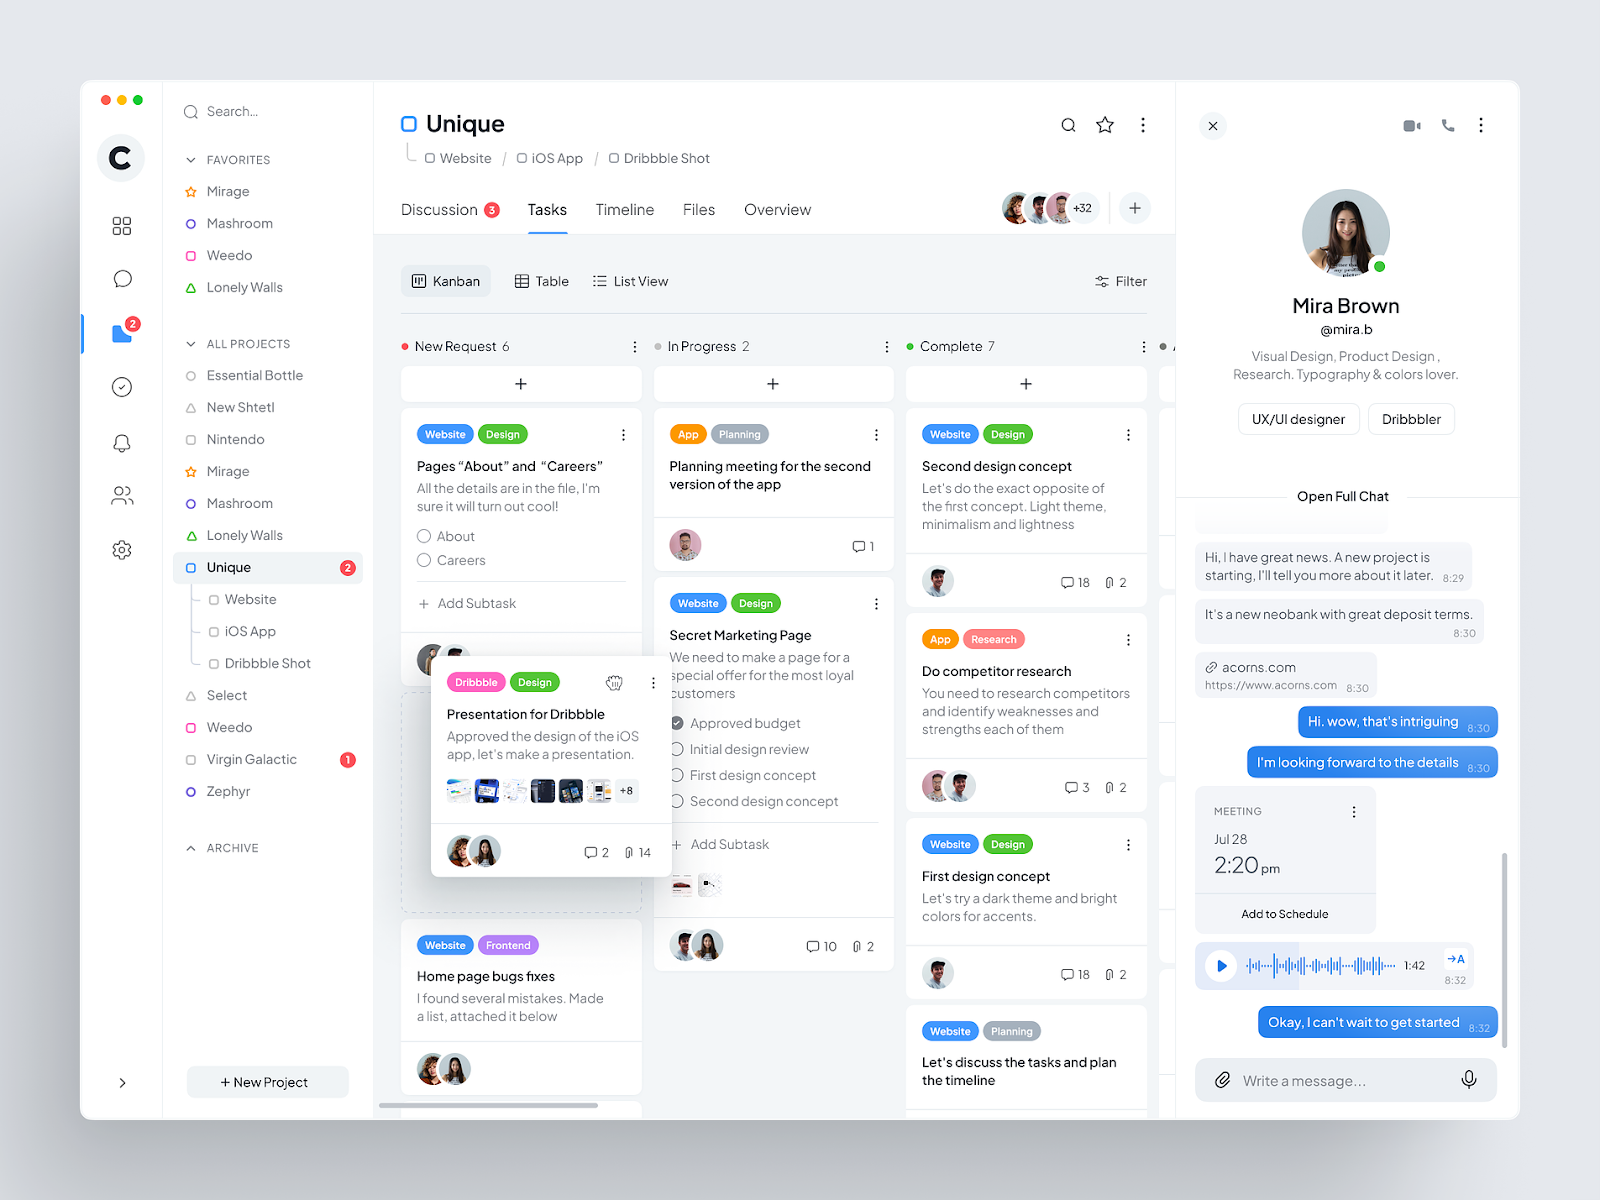
2. Operational Dashboard
An operational dashboard is like the control center for daily business operations. It’s a specialized tool that gives managers and teams real-time updates on what’s happening in the business at any moment.
For the IQNext project, we crafted a comprehensive dashboard design featuring graphical representations of data. Our solution included a real-time floor map view to support dynamic and contextual operations of devices.
So, operational dashboards are designed for the practical aspects of daily work and helps track tasks, manage resources efficiently, and ensure that everything runs smoothly. The dashboard is essential for managers and teams, offering detailed insights to make informed decisions and maintain operational efficiency.
The operational dashboard is a crucial asset with instant data updates, process monitoring, task management tools, and more.
Key Features
- Real-Time Data: It offers an immediate snapshot of the current business landscape. You get a dynamic display of up-to-the-minute information.
- Process Monitoring: Tracks and evaluates the efficiency of operational processes, ensuring that workflows align with organizational goals and standards.
- Task Management Tools: It has robust tools for managing daily tasks and assignments. This streamlines the task allocation process and ensures that things are done on time.
- Alerts and Notifications: A sophisticated alert system delivers instant notifications for critical issues. You get prompt and effective responses to potential challenges.
- Workflow Visualization: Visual insights into operational workflows enhance comprehension. This facilitates strategic decision-making regarding process optimization.
- Employee Performance Data: It functions as a comprehensive performance tracker. This is your dashboard if you want individual or team performance data to support effective management and coaching.
- Inventory Tracking: Monitors inventory levels and oversees the status of the supply chain. If there is any fluctuation in demand, it ensures accurate and timely responses.
- Customer Service Metrics: Imagine a feedback machine that tracks customer interactions and satisfaction. Similarly, the dashboard tracks and analyzes customer interactions and satisfaction metrics.
- Compliance Monitoring: No shortcuts! It ensures operations stick to regulatory standards and industry compliance. You need someone to safeguard against potential legal or operational risks. Right?
Who is it for?
Operational dashboards are primarily utilized in sectors where operational efficiency and real-time performance monitoring are crucial, such as manufacturing, logistics, customer service centers, and retail operations.
They are indispensable tools for operations managers, who rely on them to ensure smooth and efficient process flows, as well as frontline employees and middle managers in specific operational departments like manufacturing and logistics, who use them to stay on top of performance metrics and address issues swiftly.
Additionally, IT and data analytics teams often leverage these dashboards to keep an eye on system performance and data integrity, making operational dashboards central to enhancing business processes and operational agility by offering immediate insights into operational metrics.
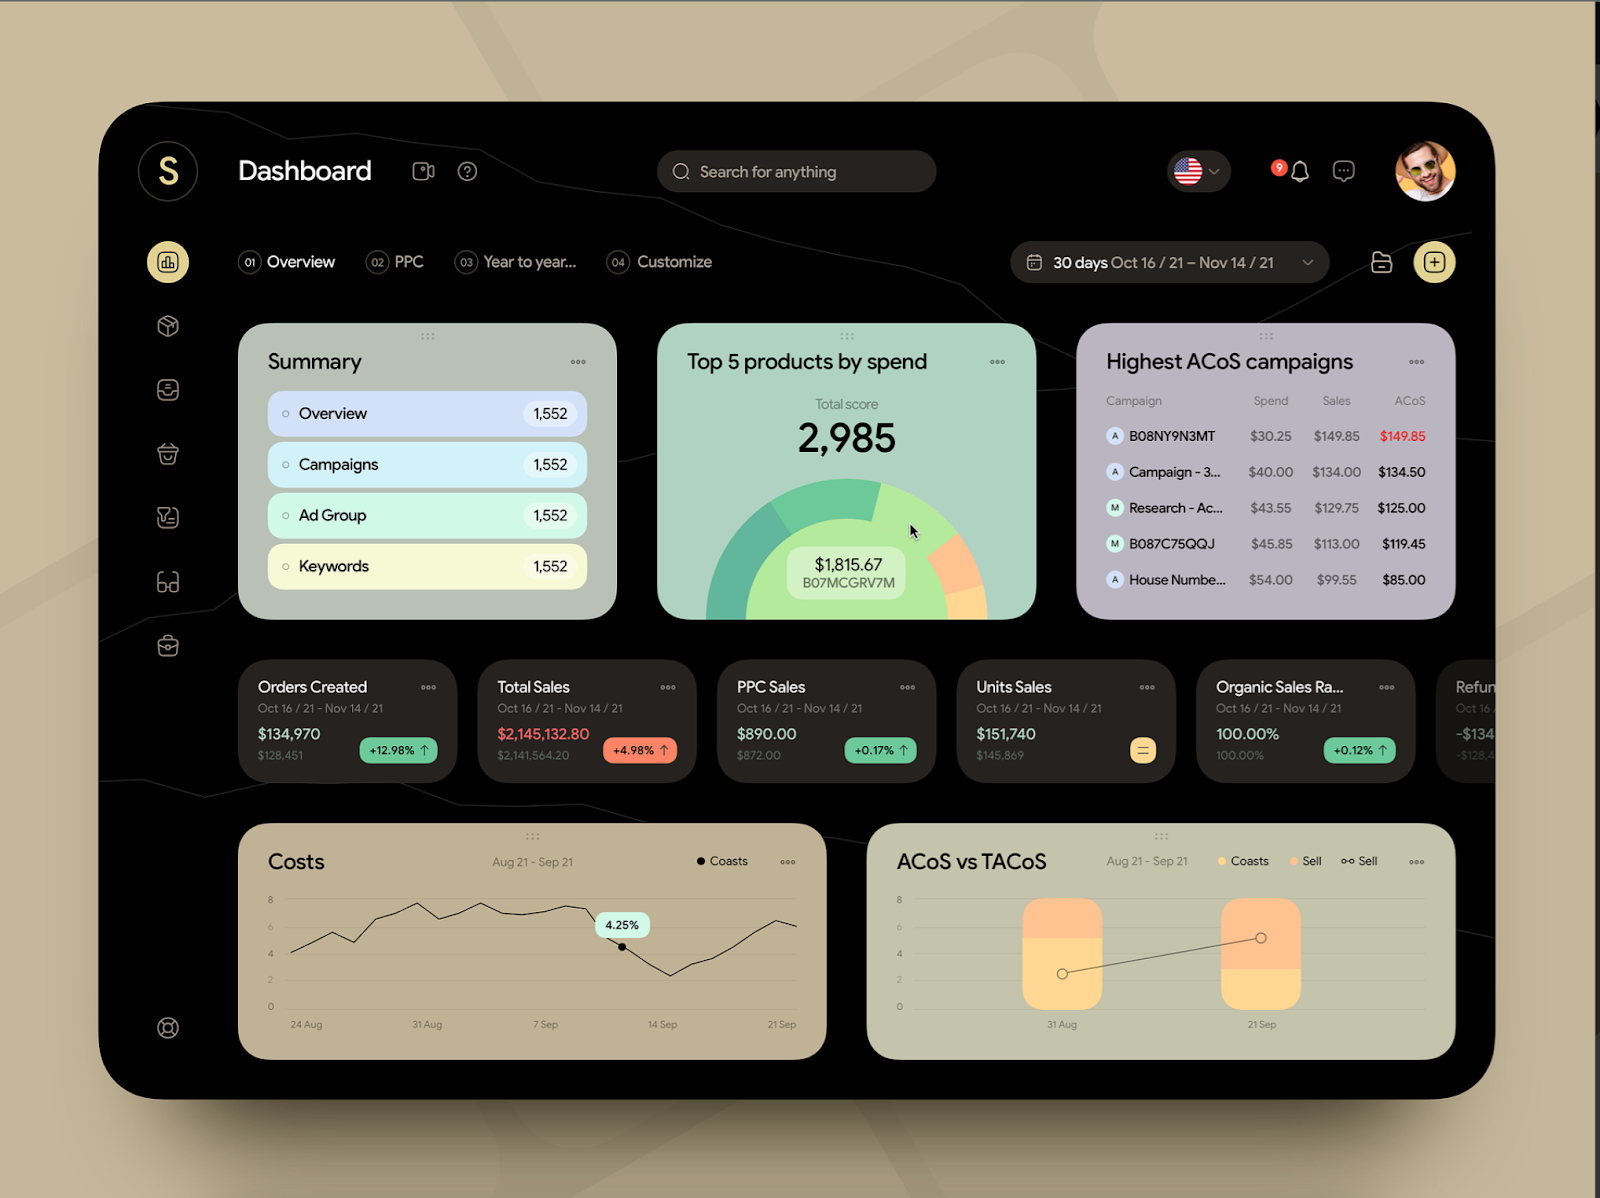
3. Tactical Dashboards
Tactical dashboards bridge the gap between strategic and operational dashboards. They provide mid-level managers with insights into specific areas of the business, allowing them to make tactical decisions to improve performance and address issues.
A Tactical Dashboard is designed to assist in short to medium-term decision-making by providing insights into the performance of specific departments or projects.
It bridges the gap between high-level strategic goals and day-to-day operational data, focusing on metrics that help managers adjust tactics to meet strategic objectives.
Key Features
- Focused Metrics: Displays metrics that are specifically chosen for mid-term planning and departmental or project-specific goals.
- Comparative Analysis: Offers the ability to compare current performance against historical data or benchmarks to track progress over time.
- Drill-Down Capability: Allows users to drill down into the data for more detailed analysis, helping to identify the root cause of issues.
- Alerts and Notifications: Features customizable alerts to notify users of deviations from expected performance levels, enabling quick responses.
- Trend Analysis: Includes tools for identifying and analyzing trends within the data to forecast future performance and adjust tactics accordingly.
- Customizable Views: Provides customizable views and filters so that different users can focus on the metrics that matter most to their specific roles and objectives.
- Integration of Data Sources: Can integrate data from various sources, giving a more comprehensive view of performance across different aspects of the business.
- Collaborative Features: Facilitates sharing and collaboration among team members, enabling them to discuss insights and strategies directly within the dashboard.
- Goal Tracking: Enables tracking of progress towards specific tactical goals or KPIs, showing how individual efforts contribute to strategic objectives.
- Actionable Insights: Prioritizes actionable insights, presenting data in a way that directly informs decision-making and tactical adjustments.
Who is it for?
Tactical dashboards are predominantly used by mid-level managers across departments like marketing, sales, HR, and finance to swiftly adjust strategies and meet specific project milestones.
These dashboards offer critical insights for effective tactical management, ensuring alignment with broader strategic goals. They're essential for project managers to maintain timelines, resource management, and adapt tactics to project challenges. Department heads rely on them for overseeing units while ensuring data-driven tactical decisions.
Additionally, business analysts utilize tactical dashboards to provide actionable insights for informed decision-making, making them indispensable for aligning short-term actions with long-term strategies.
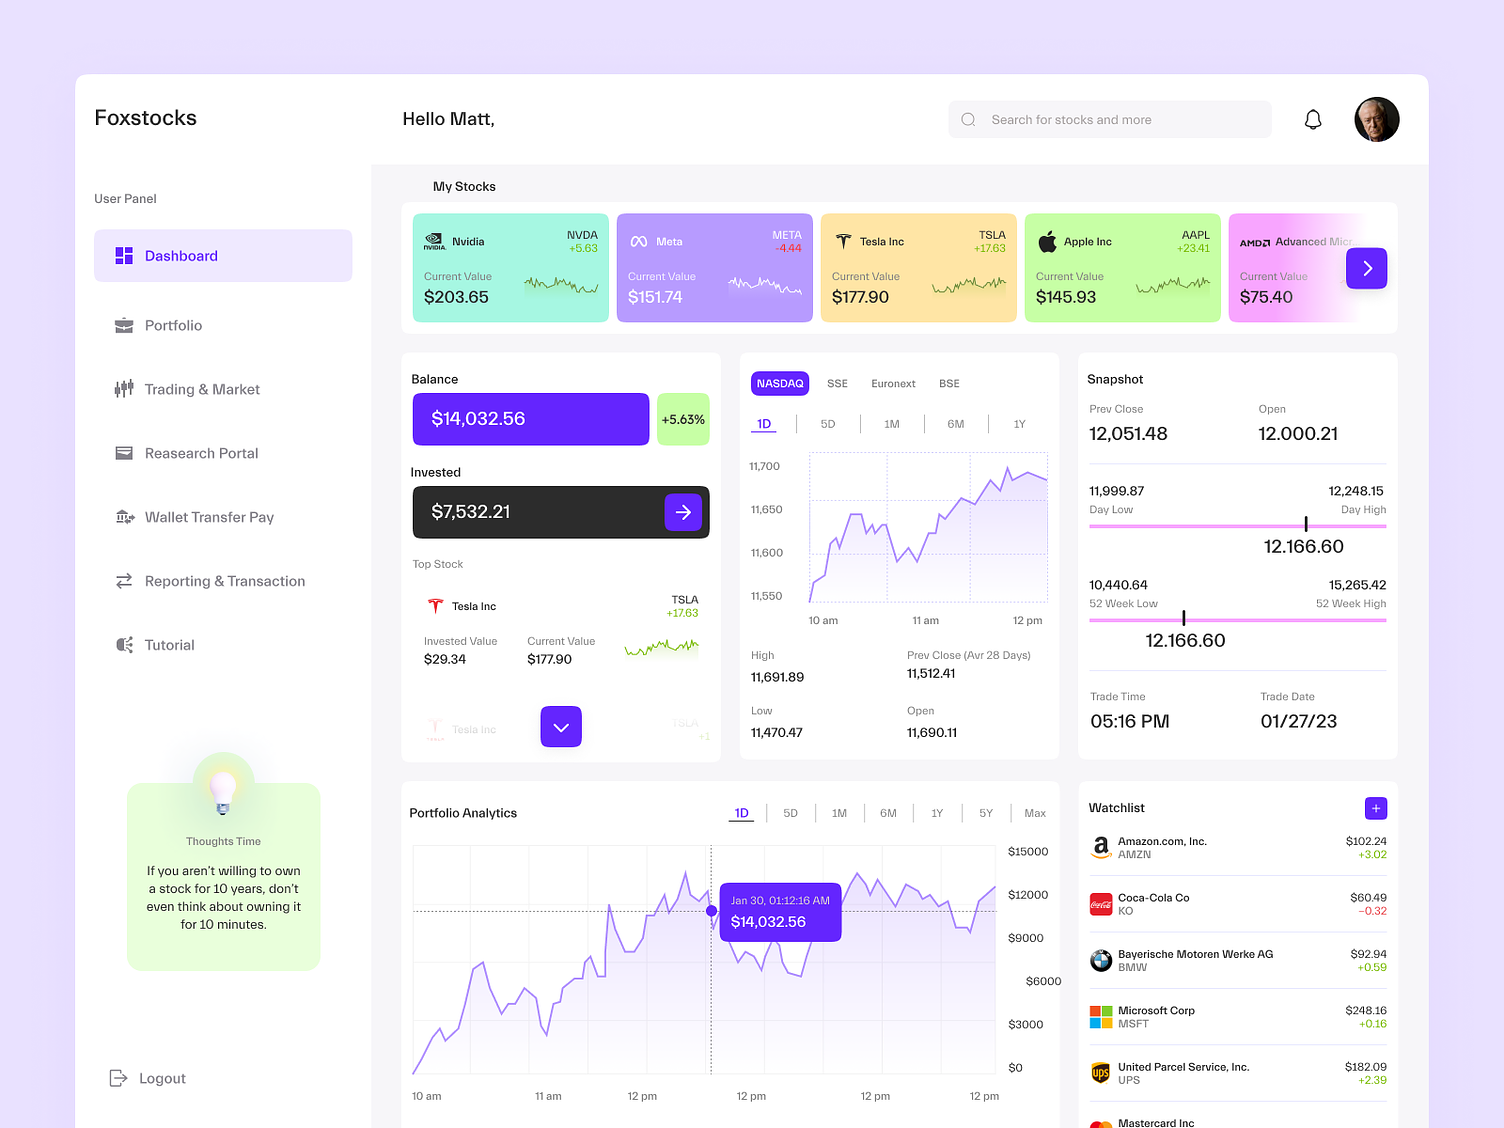
4. Analytical Dashboard
An analytical dashboard is like the intelligent brain of your business operations. It’s a tool that takes all the complex data your business generates and turns it into clear insights, like having a data expert at your fingertips.
Unlike dashboards for daily tasks, the analytical one steps back to give you a big-picture view of your business. It’s all about digging deep into data to find trends, patterns, and intelligent strategies.
This type of dashboard is a must-have for decision-makers. It gives them powerful tools to analyze and visualize data, helping turn numbers into intelligent business moves.
Key Features
- Data Exploration Tools: These are like treasure maps for data explorers. They help you navigate through tons of information.
- Advanced Analytics: Think of this as having a superhero data scientist. It goes beyond the basics, using advanced methods to uncover hidden patterns and insights in your data.
- Interactive Reports: It lets you click, explore, and get the details you need, making data a hands-on experience.
- Data Correlation Tools: It helps you find connections between different pieces of data – revealing relationships that might not be obvious at first glance.
- Customizable Filters: Customizable filters let you narrow your focus. They show only the information that matters most to you – making data less overwhelming.
- Graphs and Charts: Graphs and charts turn boring numbers into visual masterpieces. You get to see trends and patterns at a glance.
- Drill-Down Capability: Drill-down capability lets you go from the big picture to the tiny details. It’s like zooming into a map.
- Data Export Options: Imagine having a data passport. Data export options let you take your findings wherever you need them – whether for a presentation or to share insights with your team.
- Performance Indicators: These are like the scorecards for your business game. Performance indicators give you a quick overview of how healthy things are going, helping you stay on top of your business’s performance.
Who is it for?
These dashboards serve as invaluable tools for data analysts, business intelligence professionals, and decision-makers who are tasked with deriving actionable insights from complex datasets.
Data analysts leverage analytical dashboards to conduct thorough data exploration, perform ad-hoc queries, and uncover trends, patterns, and correlations within the data. Business intelligence professionals rely on these dashboards to translate data into actionable insights, supporting strategic decision-making processes.
Additionally, decision-makers utilize analytical dashboards to gain a comprehensive understanding of business performance and trends, empowering them to make informed decisions that drive organizational success.
Conclusion
In conclusion, the diverse array of dashboard types within the realm of UI/UX design represents a multifaceted approach to translating data into actionable insights.
From strategic dashboards providing high-level overviews to analytical dashboards facilitating in-depth exploration, as the best UI UX Company in India, we analyze the unique purpose of your buisness. Our goal is to empower users with the tools they need to make informed decisions.
By seamlessly blending functionality with aesthetics, these dashboards not only offer clarity and efficiency but also foster a deeper understanding of complex datasets.
As organizations continue to navigate the ever-evolving landscape of data-driven decision-making, the importance of thoughtfully designed dashboards cannot be overstated.
They stand as powerful tools, bridging the gap between data and action, and driving success in today's dynamic business environment.
Whether it's optimizing operations, refining marketing strategies, or guiding strategic initiatives, the design of dashboards plays a crucial role in unlocking the full potential of data and empowering organizations to thrive in an increasingly competitive world.Ready to enhance your business operations and align with your data insights? Sign up for our dashboard design services today!


